去年あたりから急速に知名度をあげている[生ログ収集 → グラフ表示]のツールとしてFluentd + GrowthForecastがあります。
いろいろなblogで紹介されていることからも人気の高さが伺えます。
なぜ、こんなに人気なのかというと、 ログ収集基盤としてFluentd、メトリクス収集とグラフ化のGrowthForecastともに、 コンパクト・扱いやすさ・完成度が高く・いろいろな応用が効きプラガブル・かつ簡単に導入可能といったところが挙げられるでしょう。
今回は、nginxのインストールから始め、MySQL、perlbrew、cpanmといった周辺ミドルウェアのインストール方法も網羅して紹介していきます。
また、nginxのアクセスログのフォーマットをLTSV形式にしたりと、流行を追ってみました。
これらのツールを組み合わせて、サイトのステータスコードとレスポンスタイムをほぼリアルタイム(1分間隔)で以下の様なグラフを表示・更新できるようにするのがこのエントリーの目的です。
目次
1. OS環境
2. nginxをインストール
3. perlbrewをインストール
4. cpanmをインストール
5. GrowthForecastをインストール
6. Fluentd(td-agent)をインストール
7. nginx →LTSV →Fluentd(td-agent) →GrowthForecast
8. まとめ
OS環境
CentOS 6.4 64ビット
nginxをインストール
今回は、httpサーバとしてnginxを使います。
nginxのyumレポジトリを設定します。
# vi /etc/yum.repos.d/nginx.repo
[nginx]
name=nginx repo
baseurl=http://nginx.org/packages/centos/6/$basearch/
gpgcheck=0
enabled=1
nginxをインストール。
# yum install nginx
nginxのアクセスログのフォーマットをLTSVフォーマット(http://ltsv.org/)に変更します。
httpコンテキストを編集しましょう。
# vi /etc/nginx/nginx.conf
http {

~~~省略~~~

    # 追記
    log_format  ltsv  'time:$time_local\t'
                      'host:$remote_addr\t'
                      'request:$request\t'
                      'status:$status\t'
                      'size:$body_bytes_sent\t'
                      'referer:$http_referer\t'
                      'ua:$http_user_agent\t'
                      'reqtime:$request_time\t'
                      'upsttime:$upstream_response_time';

    # access_logのフォーマットタグをmainからltsvに変更
    access_log  /var/log/nginx/access.log  ltsv;
nginxをスタート。
# /etc/init.d/nginx configtest
# /etc/init.d/nginx restart
ブラウザでWEBサイトにアクセスして、ログを確認します。
# tail -f /var/log/nginx/access.log
time:18/Apr/2013:00:39:57 -0700 host:192.168.17.1       request:GET / HTTP/1.1  status:200      size:612        referer:-    ua:Mozilla/5.0 (Windows NT 6.1; WOW64) AppleWebKit/537.31 (KHTML, like Gecko) Chrome/26.0.1410.64 Safari/537.31  reqtime:0.000upsttime:-
time:18/Apr/2013:00:39:57 -0700 host:192.168.17.1       request:GET /favicon.ico HTTP/1.1       status:404      size:570     referer:-        ua:Mozilla/5.0 (Windows NT 6.1; WOW64) AppleWebKit/537.31 (KHTML, like Gecko) Chrome/26.0.1410.64 Safari/537.31       reqtime:0.000   upsttime:-
こんな感じのログになったでしょうか?
perlbrewをインストール
perlbrewは、perlのインストール管理ツールです。
複数のPerlバージョンをインストールしたり切り替えたりができます。
RubyでいえばRVM、Pythonでいえばpythonbrewのようなものです。
GrowthForecastは、Perl製なので、このツールを使ってPerlを管理します。
perlbrewをインストール
# curl -kL http://install.perlbrew.pl | bash
# source ~/perl5/perlbrew/etc/bashrc
perlbrewのバージョンを確認
# perlbrew --version
/root/perl5/perlbrew/bin/perlbrew  - App::perlbrew/0.62
使用可能なperlのバージョンを確認。
# perlbrew available
  perl-5.17.10
  perl-5.16.3
  perl-5.14.4
  perl-5.12.5
  perl-5.10.1
  perl-5.8.9
  perl-5.6.2
  perl5.005_04
  perl5.004_05
  perl5.003_07
Perlのメジャーリリースバージョンを選びます。
公式サイト(http://dev.perl.org/)を見ると、”Perl 5.16.3 is the current stable version of Perl.”とあるので、perl-5.16.3をインストールします。
# perlbrew install 5.16.3
インストールには、けっこう時間がかかります。
コーヒーでも飲んでゆっくり待ちましょう。 せっかちな人は、インストールログを眺めることもできます。
# tail -f ~/perl5/perlbrew/build.perl-5.16.3.log
インストールが完了したら、インストールしたPerlをperlbrew listで確認。
# perlbrew list
  perl-5.16.3
perlbrewで、Perlを切り替えます。
# perlbrew switch 5.16.3
再度、perlbrew listで確認します。
先頭に米印がついてるバージョンが、選択しているPerlのバージョンです。
# perlbrew list
* perl-5.16.3
perlbrewで選択した、Perlのインストールディレクトリを確認。
# which perl
/root/perl5/perlbrew/perls/perl-5.16.3/bin/perl
インストールされたPerlのバージョンを確認。
# /root/perl5/perlbrew/perls/perl-5.16.3/bin/perl -v

This is perl 5, version 16, subversion 3 (v5.16.3) built for x86_64-linux

Copyright 1987-2012, Larry Wall

Perl may be copied only under the terms of either the Artistic License or the
GNU General Public License, which may be found in the Perl 5 source kit.

Complete documentation for Perl, including FAQ lists, should be found on
this system using "man perl" or "perldoc perl".  If you have access to the
Internet, point your browser at http://www.perl.org/, the Perl Home Page.
次回のsshログイン時にperlbrewが有効になるように、.bashrcに追記しておきます。
# echo 'source ~/perl5/perlbrew/etc/bashrc' >> ~/.bashrc
cpanmをインストール
cpanminus cpanmは、PerlのCPANモジュールをインストールするためのツールで、CPANシェルよりも省メモリで動作します。
また、perlbrewと組み合わせる事によってローカルユーザ領域にCPANモジュールをインストールする事ができます。 GrowthForecastは、CPANモジュールとして登録されていますので、cpanmを使ってインストールします。
perlbrewを使ってcpanmをインストールします。
# perlbrew install-cpanm
cpanmのバージョンを確認。
# cpanm -v
cpanm (App::cpanminus) 1.6108 on perl 5.016003 built for x86_64-linux
Work directory is /root/.cpanm/work/1366079778.16902
You have make /usr/bin/make
You have /usr/bin/wget
You have /bin/tar: tar (GNU tar) 1.23
Copyright (C) 2010 Free Software Foundation, Inc.
License GPLv3+: GNU GPL version 3 or later .
This is free software: you are free to change and redistribute it.
There is NO WARRANTY, to the extent permitted by law.

Written by John Gilmore and Jay Fenlason.
You have /usr/bin/unzip
Usage: cpanm [options] Module [...]

Try `cpanm --help` or `man cpanm` for more options.
GrowthForecastをインストール
GrowthForecastのオプションや使い方については、公式サイトを見るとわかりやすく書いてあります。
http://kazeburo.github.io/GrowthForecast/
GrowthForecastに必要なyumパッケージをインストール。
# yum groupinstall "Development Tools"
# yum install pkgconfig glib2-devel gettext libxml2-devel pango-devel cairo-devel
cpanmでGrowthForecastをインストール。
# cpanm -n GrowthForecast
お茶でも飲んでゆっくり待ちましょう。
詳細なインストールログはこちらから。
# tail -f ~/.cpanm/build.log
GrowthForecastがRRDデータを保存するディレクトリを作成しておきます。
# mkdir /usr/share/growthforecast
GrowthForecastのヘルプを確認。
キーボードの[↑][↓]もしくは[u][d]でスクロール、[q]でヘルプを終了します。
# growthforecast.pl --help
GrowthForecastをフォアグラウンドで起動テストをします。
# growthforecast.pl --data-dir=/usr/share/growthforecast
ブラウザでアクセスしてみましょう。 デフォルトのポートは5125です。
http://[ホスト]:5125/
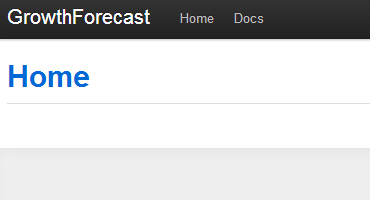
GrowthForecastのホーム画面が表示されれば成功です。
このまま、sshクライアントを閉じてもGrowthForecastにつながる筈です。
再び、ブラウザでアクセスして確認します。
http://[ホスト]:5125/
GrowthForecastをシャットダウンするときは、killします。
# ps ax | grep growthforecast
# pkill -KILL -f growthforecast
GrowthForecastのデータは以下のディレクトリに設置されます。
# cd /usr/share/growthforecast; ls -al;
total 1136
drwxr-xr-x 2 root root   4096 May 14 16:47 .
drwxr-xr-x 5 root root   4096 May 14 16:47 ..
-rw-r--r-- 1 root root 204256 May 14 16:47 c4ca4238a0b923820dcc509a6f75849b.rrd
-rw-r--r-- 1 root root 154784 May 14 16:47 c4ca4238a0b923820dcc509a6f75849b_s.rrd
-rw-r--r-- 1 root root 204256 May 14 16:47 c81e728d9d4c2f636f067f89cc14862c.rrd
-rw-r--r-- 1 root root 154784 May 14 16:47 c81e728d9d4c2f636f067f89cc14862c_s.rrd
-rw-r--r-- 1 root root   1024 May 14 16:47 gforecast.db
-rw-r--r-- 1 root root  32768 May 14 16:47 gforecast.db-shm
-rw-r--r-- 1 root root 397224 May 14 16:47 gforecast.db-wal
GrowthForecastの起動スクリプトを作っておくと便利です。
こちらのblogが参考になります。
GrowthForecastをinit.dを用いて自動起動する方法
ApacheのSSLプロキシ経由でアクセスするときには、こちらが参考になります。
https://github.com/kazeburo/GrowthForecast/issues/3#issuecomment-6750424
Fluentd(td-agent)をインストール
td-agentは、Treasure Data, Inc.(http://www.treasure-data.com/)によって提供されているFluentdの安定版ディストリビューションパッケージです。
こちらのblogが参考になります。
fluent-agent-lite と td-agent で、小さくはじめる fluentd
td-agentは、自分の中にruby環境を内包してfluentdを動かしてくれるので、ruby環境を用意しなくても、非破壊的かつ簡単にfluentdをはじめることができます。
Fluentdの概要については、CodeZineの記事がわかりやすいです。
Treasure Dataのyumレポジトリを設定します。
# vi /etc/yum.repos.d/td.repo
[treasuredata]
name=TreasureData
baseurl=http://packages.treasure-data.com/redhat/$basearch
gpgcheck=0
yumでtd-agentパッケージをインストール。
# yum install td-agent
動作テストをしてみましょう。
# mv /etc/td-agent/td-agent.conf /etc/td-agent/td-agent.conf.org
# vi /etc/td-agent/td-agent.conf

  type forward
  tag test


  type file
  path /tmp/test
意味は、このようになります。
sourceセクション
forward Input Pluginを使用し、TCP socketからの入力にtestというタグをつける。
match testセクション
file Output Pluginを使用し、「test」タグのある入力があれば、/tmp/test*** ファイルに受け取ったデータを出力。
td-agentをスタート。
# /etc/init.d/td-agent restart
fluent-catへJSONを送る。
# echo '{"msg":"Hello World!"}' | /usr/lib64/fluent/ruby/bin/fluent-cat test
出力されたファイルを確認。
# cd /tmp/; ls -al;
# cat test.20130416.b4da88118a045e26d
2013-04-18T01:49:31-07:00       test    {"msg":"Hello World!"}
入力した内容が出力されたことがわかりますね。
nginx →LTSV →Fluentd(td-agent) →GrowthForecast
ついに最終工程です。
nginxのアクセスログのパーミッションを変更し、td-agentから参照できるようにしておきます。
# chown nginx:nginx /var/log/nginx/access.log
# chmod 644 /var/log/nginx/access.log
LTSVフォーマットのファイルをFluentdに読み込ませるために、id:stanakaさんによる fluent-plugin-tail-labeled-tsvプラグインを利用します。
git cloneして、fluent-plugin-tail-labeled-tsvを設置。
# git clone https://github.com/stanaka/fluent-plugin-tail-labeled-tsv.git
# cp fluent-plugin-tail-labeled-tsv/lib/fluent/plugin/in_tail_labeled_tsv.rb /etc/td-agent/plugin
その他のfluentdプラグインは、fluent-gemからインストールできます。
# /usr/lib64/fluent/ruby/bin/fluent-gem install fluent-plugin-datacounter
# /usr/lib64/fluent/ruby/bin/fluent-gem install fluent-plugin-growthforecast
こちらのblog LTSVフォーマットなログを fluentd + GrowthForecast で料理 を参考にnginxのアクセスログをGrowthForecastに送信するように設定します。
# vi /etc/td-agent/td-agent.conf

  type tail_labeled_tsv
  path /var/log/nginx/access.log
  tag nginx.access
  pos_file /tmp/fluent.log.pos


  type copy

    type file
    path /var/log/td-agent/nginx.access


    type growthforecast
    gfapi_url http://localhost:5125/api/
    service   nginx
    section   response
    name_keys reqtime,upsttime


    type datacounter
    unit minute
    tag nginx.access.status_count
    count_key status
    pattern1 3xx ^3\d\d$
    pattern2 4xx ^4\d\d$
    pattern3 5xx ^5\d\d$
    pattern4 200 ^200$


  type growthforecast
  gfapi_url http://localhost:5125/api/
  service   nginx
  section   status_codes
  name_keys nginx.access_5xx_count,nginx.access_4xx_count,nginx.access_3xx_count,nginx.access_200_count
td-agentをリスタート
# /etc/init.d/td-agent restart
td-agentのログを確認。
# tail -f /var/log/td-agent/td-agent.log
[error]は出ていないでしょうか? 下のようなログが出ていたらOKです。
2013-04-18 01:51:42 -0700 [info]: adding source type="tail_labeled_tsv"
2013-04-18 01:51:42 -0700 [info]: adding match pattern="nginx.access" type="copy"
2013-04-18 01:51:42 -0700 [info]: adding match pattern="nginx.access.status_count" type="growthforecast"
2013-04-18 01:51:42 -0700 [info]: following tail of /var/log/nginx/access.log
nginxのアクセスログに記録されるURLを開きます。
http://[ホスト]/
何回かアクセスしてアクセスログを出しておきましょう。
GrowthForecastにログが収集されているか確認します。
http://[ホスト]:5125/
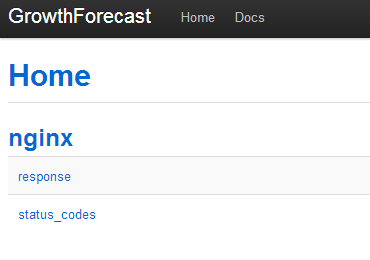
ログの収集が成功していると↑のような画面になります。
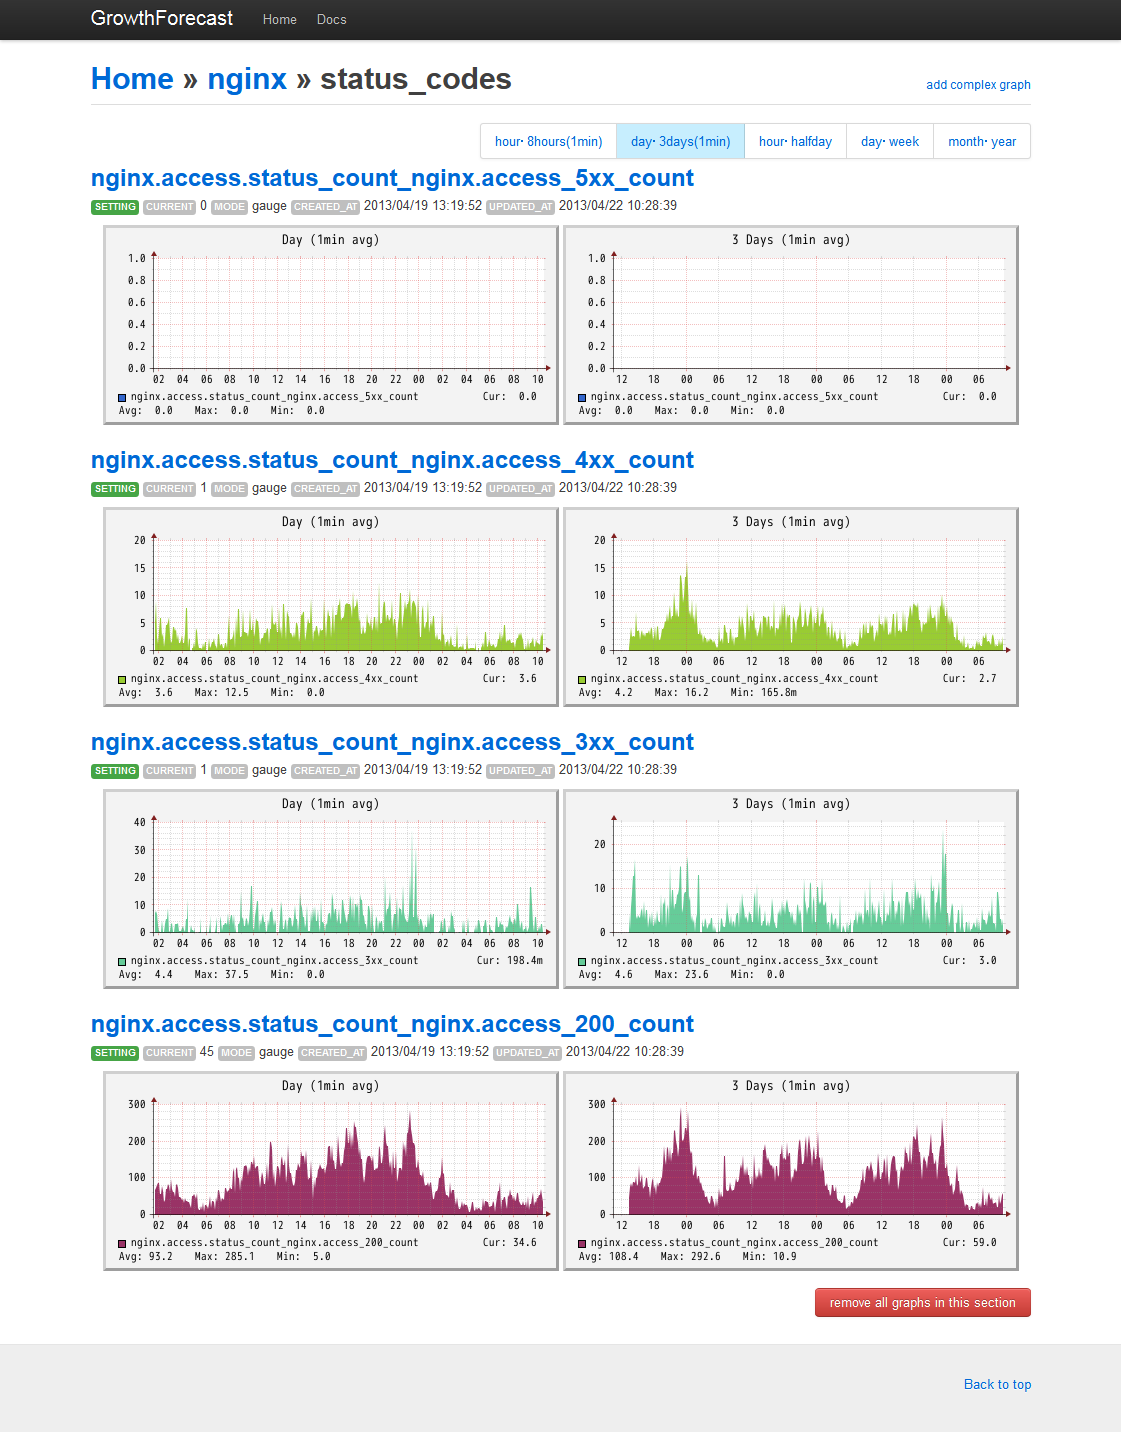
1分くらいたったら直近のグラフを確認してみましょう。
下記のようにリンクを辿ります。
[nginx] -> [status_codes] -> [hour・8hours(1min)]
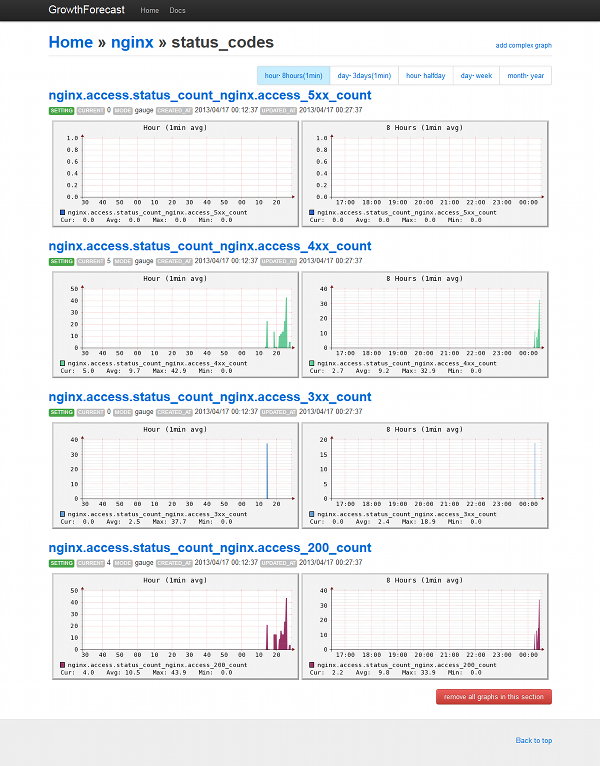
簡単ですね!
本番投入時にはnginxのプロキシ設定などで、GrowthForecastにアクセス制限を入れておきましょう。
GrowthForecastのアクセス制限については、こちらのblogが参考になります。
CentOSにGrowthForecastをいれて色々表示してみた
まとめ
nginxのアクセスログをLTSVフォーマットで出力して、Fluentd(td-agent)を使ってGrowthForecastに投入してグラフにしました。
レスポンスタイムをほぼリアルタイムでグラフ表示することによって、 いわゆるPDCAサイクルにおけるサーバやアプリケーションのCheck(点検・評価)をより迅速に行うことができるようになります。
これによって、次のサイクルであるAct(処置・改善)の評価が早まり、早期の提案やリスクの低減に繋がることが期待できます。
PICK UP
-

タグ: AIエージェント, GA4, Gemini Enterprise, Google Cloud, Google アナリティクス, ai, コラム
Gemini Enterpriseの企業導入法を解説。エージェント環境づくりと活用事例 -

タグ: ITreview, SaaS, The Best Software by Category, The Best Software in Japan 2026, shutto翻訳, ウェブサイト翻訳ツール, コラム
ITreview The Best Software by Category 2026を受賞しました! -

タグ: AI議事録, コラム, ナレッジ共有, 会議効率化, 文字起こし, 業務効率化, 生成AI活用, 生産性向上, 社内DX
【オープン社内報 2026年7月号】イー・エージェンシーグループ プレミアムニュース -

タグ: エンジニア採用, キャリア採用, コミュニケーション, コラム, ブログ, リモートワーク, ワーケーション, 採用情報, 文化, 環境
日本全国からの応募をお待ちしております! 2026年7月の募集職種一覧!ビジネス職を中心に採用強化中! -
タグ: CART RECOVERY, カゴ落ち対策, カートリカバリー, クラウドサービス, コラム, ニュース
【メディア掲載】読売新聞にて『CART RECOVERY®(カートリカバリー)』の調査データが紹介されました -

タグ: MAツール, コラム, システム比較, マーケティングオートメーション, メールマーケティング, メール到達率, メール配信, メール配信サービス, メール配信システム, メール配信ツール
【2026年最新版】中小企業向けメール配信システムの正しい選び方!初心者でも失敗しない5つの選定基準を網羅解説